From Wikipedia, the free encyclopedia
Part of the 1991 Irish local elections
1991 South Tipperary County Council election|
|
|
|
|
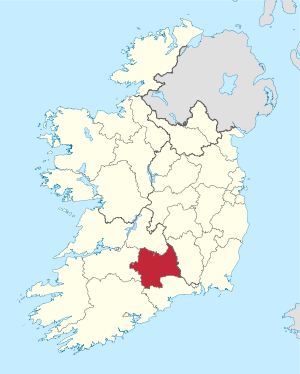 Map showing the area of South Tipperary County Council |
|
|
Council control after election
TBD
| |
An election to South Tipperary County Council took place on 27 June 1991 as part of that year's Irish local elections. 26 councillors were elected from five local electoral areas (LEAs) for a five-year term of office on the electoral system of proportional representation by means of the single transferable vote (PR-STV). This term was extended twice, first to 1998, then to 1999.[1][2]
Results by party[edit]
Results by local electoral area[edit]
Cashel - 5 seats
| Party |
Candidate |
FPv% |
Count
|
| 1 |
2 |
3 |
4 |
5 |
6 |
7 |
8 |
9
|
|
|
Fine Gael
|
Jack Crowe*
|
19.4%
|
1,298
|
|
|
|
|
|
|
|
|
|
|
Fianna Fáil
|
Senator Dr. Seán McCarthy*
|
18.34%
|
1,226
|
|
|
|
|
|
|
|
|
|
|
Fine Gael
|
Tom Wood
|
9.53%
|
637
|
663
|
676
|
686
|
731
|
759
|
950
|
1,030
|
1,088
|
|
|
Fine Gael
|
Tom Hayes
|
7.85%
|
525
|
586
|
598
|
603
|
655
|
688
|
828
|
880
|
959
|
|
|
Fianna Fáil
|
Timmy Hammersley*
|
7.78%
|
520
|
543
|
569
|
585
|
618
|
729
|
761
|
958
|
1,258
|
|
|
Fine Gael
|
Maureen O'Donoghue
|
7.49%
|
501
|
509
|
560
|
568
|
588
|
617
|
642
|
720
|
794
|
|
|
Fianna Fáil
|
Josephine Quinlan
|
7.2%
|
481
|
502
|
518
|
529
|
542
|
588
|
613
|
688
|
|
|
|
Fine Gael
|
Catherine McLoughlin
|
5.27%
|
352
|
367
|
371
|
375
|
451
|
466
|
|
|
|
|
|
Progressive Democrats
|
John Bergin
|
4.8%
|
321
|
326
|
329
|
332
|
|
|
|
|
|
|
|
Fianna Fáil
|
William McInerney
|
4.8%
|
320
|
326
|
368
|
405
|
444
|
556
|
580
|
|
|
|
|
Fianna Fáil
|
Roger Kennedy
|
4.65%
|
311
|
323
|
347
|
364
|
398
|
|
|
|
|
|
|
Sinn Féin
|
Michael Browne
|
2.89%
|
193
|
199
|
|
|
|
|
|
|
|
| Electorate: 9,963 Valid: 6,685 (67.1%) Spoilt: 48 Quota: 1,115 Turnout: 6,733 (67.58%)
|
Clonmel[edit]
Clonmel - 5 seats
| Party |
Candidate |
FPv% |
Count
|
| 1 |
2 |
3 |
4 |
5 |
6 |
7 |
8
|
|
|
WUA
|
Seamus Healy
|
20.97%
|
1,582
|
|
|
|
|
|
|
|
|
|
Fianna Fáil
|
Noel Davern TD*
|
14.13%
|
1,066
|
1,085
|
1,127
|
1,156
|
1,276
|
|
|
|
|
|
Fianna Fáil
|
Tom Ambrose*
|
10.6%
|
796
|
807
|
830
|
847
|
972
|
1,017
|
1,130
|
1,271
|
|
|
Independent
|
Ted Boyle
|
9.52%
|
718
|
751
|
785
|
864
|
899
|
969
|
1,132
|
1,408
|
|
|
Labour
|
Sean Lyons*
|
7.12%
|
537
|
562
|
630
|
734
|
766
|
821
|
925
|
1,116
|
|
|
Fine Gael
|
Johnny Kehoe*
|
6.98%
|
527
|
530
|
549
|
560
|
568
|
740
|
811
|
|
|
|
Progressive Democrats
|
Niall Dennehy
|
6.26%
|
472
|
489
|
510
|
535
|
556
|
621
|
|
|
|
|
Independent
|
Brian O'Donnell
|
6%
|
452
|
621
|
644
|
700
|
724
|
761
|
835
|
874
|
|
|
Fine Gael
|
Dominic O'Hara
|
5.86%
|
442
|
447
|
466
|
479
|
486
|
|
|
|
|
|
Fianna Fáil
|
Michael Kennedy
|
4.69%
|
354
|
363
|
372
|
392
|
|
|
|
|
|
|
Labour
|
Jimmy Keating
|
4.02%
|
303
|
323
|
368
|
|
|
|
|
|
|
|
Labour
|
Mary-Ann Burke
|
3.92%
|
296
|
309
|
|
|
|
|
|
|
| Electorate: 12,368 Valid: 7,545 (61%) Spoilt: 65 Quota: 1,258 Turnout: 7,610 (61.53%)
|
Fethard[edit]
Fethard - 6 seats
| Party |
Candidate |
FPv% |
Count
|
| 1 |
2 |
3 |
4 |
5 |
6 |
7 |
8
|
|
|
Fianna Fáil
|
Ned Meagher*
|
17.7%
|
1,449
|
|
|
|
|
|
|
|
|
|
Labour
|
Ned Brennan*
|
16.6%
|
1,360
|
|
|
|
|
|
|
|
|
|
Fine Gael
|
John Holohan*
|
16.05%
|
1,314
|
|
|
|
|
|
|
|
|
|
Labour
|
Denis Landy
|
9.63%
|
788
|
793
|
882
|
887
|
988
|
1,048
|
1,234
|
|
|
|
Fianna Fáil
|
Denis Bourke*
|
8.25%
|
675
|
719
|
728
|
731
|
793
|
837
|
1,074
|
1,103
|
|
|
Fine Gael
|
Jimmy Hogan*
|
7.93%
|
649
|
657
|
673
|
744
|
821
|
919
|
1,037
|
1,065
|
|
|
Fianna Fáil
|
Dick Tobin*
|
7.67%
|
628
|
730
|
746
|
769
|
781
|
877
|
1,002
|
1,009
|
|
|
Fianna Fáil
|
Patsy Murphy
|
7.09%
|
580
|
617
|
623
|
628
|
712
|
750
|
|
|
|
|
Progressive Democrats
|
Jack Murphy
|
4.58%
|
375
|
455
|
504
|
537
|
558
|
|
|
|
|
|
Independent
|
Jack Lalor
|
4.5%
|
368
|
371
|
376
|
380
|
|
|
|
|
| Electorate: 12,561 Valid: 8,186 (65.17%) Spoilt: 87 Quota: 1,170 Turnout: 8,273 (65.86%)
|
Tipperary[edit]
Tipperary - 5 seats
| Party |
Candidate |
FPv% |
Count
|
| 1 |
2 |
3 |
4 |
5 |
6 |
7
|
|
|
Labour
|
Michael Ferris TD*
|
25.84%
|
1,825
|
|
|
|
|
|
|
|
|
Fine Gael
|
Brendan Griffin
|
11.86%
|
838
|
954
|
966
|
975
|
1,128
|
1,252
|
|
|
|
Fine Gael
|
Michael Fitzgerald*
|
11.49%
|
812
|
880
|
885
|
974
|
1,070
|
1,150
|
1,181
|
|
|
Fianna Fáil
|
Michael Maguire*
|
11.48%
|
811
|
867
|
869
|
1,000
|
1,073
|
1,220
|
|
|
|
Independent
|
Christy Kinahan
|
10.84%
|
766
|
872
|
904
|
918
|
936
|
1,080
|
1,106
|
|
|
Fianna Fáil
|
John Wallace
|
9.77%
|
690
|
750
|
764
|
862
|
915
|
1,023
|
1,040
|
|
|
Labour
|
Thady Byrnes
|
6.64%
|
469
|
652
|
674
|
682
|
732
|
|
|
|
|
Fine Gael
|
P.J. Maher
|
8.12
|
6%
|
451
|
452
|
456
|
|
|
|
|
|
Fianna Fáil
|
Dan O'Keeffe
|
4.86%
|
343
|
363
|
365
|
|
|
|
|
|
|
Workers' Party
|
Peadar O'Donnell
|
1.17%
|
83
|
97
|
|
|
|
|
|
| Electorate: 10,571 Valid: 7,064 (66.8%) Spoilt: 67 Quota: 1,178 Turnout: 7,131 (67.46%)
|
References[edit]
External links[edit]


